1. Equal Access
You have a right to:
Equal access to affordable and optimal cancer care, including the right to a second opinion.
Three key questions that every cancer patient may choose to ask:
- Will my care be the best available and comparable to other high quality cancer care and good clinical cancer practice in my country and elsewhere in Europe?
- Are patient outcomes in our cancer care service as good in general as in other centres in my country and elsewhere in Europe?
- Do I have the right to ask for a second opinion if I so wish?
Explanation
European cancer patients should receive affordable, best available cancer care in their own country which is comparable to other high quality cancer services in Europe. The cornerstone of the European Code of Cancer Practice (The Code) is the right of Europe’s cancer patients to have equal access to such cancer care. This means that you have the choice where to be treated and by whom, coupled with the right to obtain information about where best results are achieved. If you have a rare cancer (or are a paediatric patient), you also have the right to engage with the European Reference Networks (ERNs) relevant to your disease, if good clinical cancer practice for your disease is not available to you within your local area. Each cancer patient, with their family and carers, should have the opportunity to discuss with their healthcare professionals whether the care that they will receive is the best available within their healthcare system and whether it is of the standard of good clinical cancer practice required by clinical guidelines.
Currently, there are inequalities in access to best available cancer care, both within and between European countries and between different regions within some countries. Many factors determine these inequalities, including the cost of care, the organisation of care, access to the right technologies, and the availability of skilled healthcare professionals to deliver the required treatment to the highest standard. In many countries, it is possible to access good clinical cancer practice which is in keeping with published guidelines based on the best available scientific and biomedical evidence. This may be provided close to a patient’s home or, when essential, by referral to a cancer centre which may be some distance away. Discussions between the patient and cancer professionals should identify the best available care options, so that the patient can make an informed choice.
Patients should always have the right to a second opinion, in relation to their diagnosis and/or the treatment of their cancer and subsequent care.
Supporting Literature and Evidence
Central to the European Code of Cancer Practice is the right of patients to access affordable and optimal available cancer care. Unfortunately, there is compelling evidence that not all European countries currently provide access to good clinical cancer practice and this is reflected in the survival of their cancer patients. The evidence which characterises the inequalities in cancer care across Europe and the key features of good clinical cancer practice have been summarised in the Section 3. These features are described in cancer service specifications (36-43) and by detailed guidelines (44-57) prepared by European and national Governmental and non-Governmental organisations. The introduction and adherence to good clinical cancer practice into a national cancer care system is an important factor in the improvement seen in cancer outcomes in some, but not all, European countries in recent decades.
To understand the variations in cancer outcomes that exist between European countries, we need to evaluate degree of access to care, rates of survival from cancer, and the degree of disability from cancer in their populations. Patient survival is clearly a vitally important measure to reflect the impact of good clinical cancer practice in different countries. It is a measure of the proportion of people diagnosed with a cancer who are still alive after a specified period of time, often a five-year survival rate, although long-term ten-year survival rates are also available for certain countries. Many factors, as well as good clinical practice, influence survival. For example, cancer survival for a country over all cases will be worse when the mix of cancers in a population includes a high proportion of cancer types which have poor survival, such as lung cancer. The age distribution of the population and the impact of other illnesses can also be important. For these reasons, epidemiological reports commonly adjust survival figures by relating them to the absolute survival of the population as a whole (called the “net survival” or “relative survival”). This adjusts for the background mortality due to other causes of death. Since net survival also varies with age, for purposes of comparisons between countries, it is possible to use age standardise survival rates often using the International Cancer Survival Standard (ICSS) (6). At a policy and strategy level, examples of good data collection and analysis include the EUROCARE, CONCORD and the International Cancer Benchmarking Project (ICBP) projects (17, 96 and 97). These have demonstrated the wide disparities in cancer outcomes between countries and they have underpinned a wide variety of national and European projects in cancer control.
The Comparator Report on Cancer in Europe in 2019 gives information on net survival in a variety of cancers and European countries (6). For example, Figure 9 shows these data for five-year age standardised net survival rates for colon cancer.
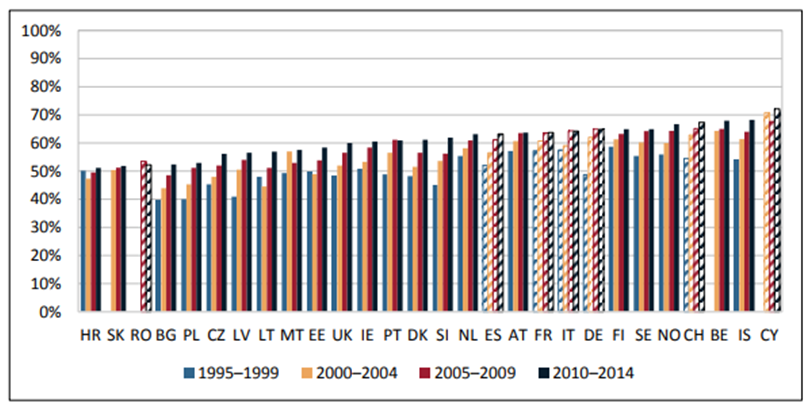
Figure 9. 5-year age-standardized net survival rates for colon cancer in European adult patients (15–99 years), 1995–2014 (6). Hatched bars are based on regional data or neighbouring countries in all Figures
In most countries, there is clear evidence of improvement in survival in the study period (Figure 9, 6). However, there is considerable variation between countries and in the 2010 – 2014 data from the Comparator Report, survival ranged from 51% in Croatia to 68% in Belgium and Iceland. In these data, over half of the European countries are now reporting survivorship at five years at or above 60% of patients for colon cancer. There is a pattern in which wealthier countries are generally seen to record higher survival rates compared to poorer countries, although the UK, Ireland and Denmark are relatively wealthy countries with relatively lower survival (6).
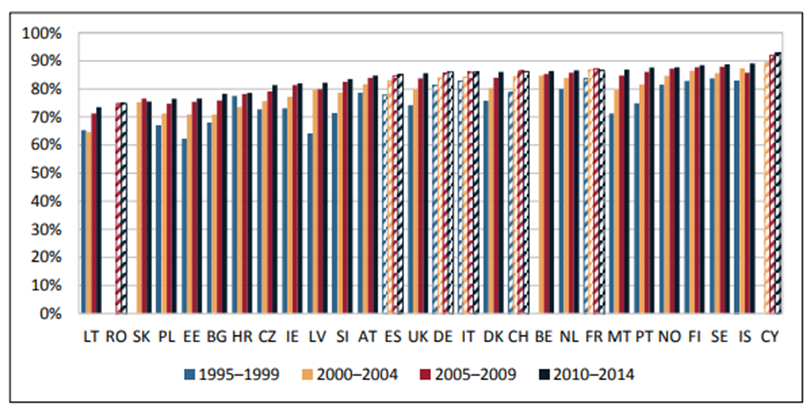
Figure 10. 5-year age-standardized net survival rates for breast cancer in female European adult patients (15–99 years), 1995–2014 (6). Hatched bars are based on regional data or neighbouring countries in all Figures
Figure 10 shows the five-year age standardised net survival for breast cancer (6). Again, improvements in most countries are apparent, with well over half of European countries reporting survivorship of over 80% at five years, but considerable diversity in the results in different countries is also observed for breast cancer patients, with many approaching 90% survival. Unfortunately, the inequalities in survival are still apparent (6).
Disability for Cancer
Although the number of deaths from cancer is a vitally important indicator of the challenges and burden of the diseases, the wider impacts on patients and on society include the morbidity of the disease, resulting from symptoms experienced by patients in their everyday lives, caused by the disease and its treatment. The World Health Organization has developed a useful comprehensive measure of disease burden (6, 98). These are known as Disability-Adjusted Life Years (DALYs). One DALY represents one year of healthy life lost. The sum of DALYs in any country is a reflection of the burden of disease in that country. DALYs are the sum of the Years of Lost Life (YLL) due to premature death and the Years of Lost Life to Disability (YLLD) for people living with the disease. Figure 11 shows the disease burden measures in DALYs due to cancer and its sequalae in 31 European countries (6).
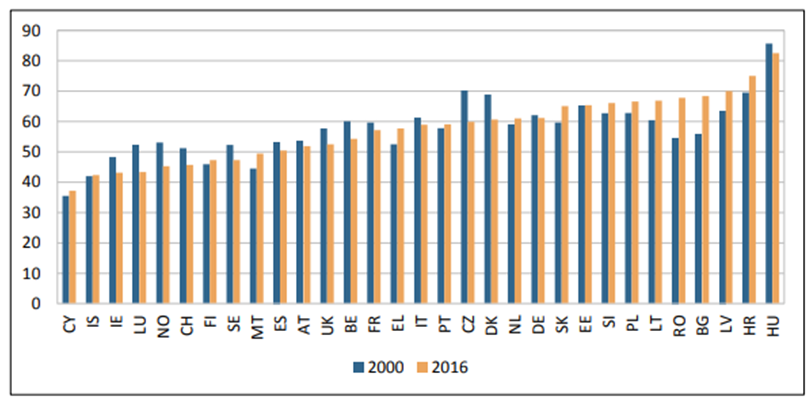
Figure 11. DALYs caused by cancer per 1,000 inhabitants, 2000 & 2016 (6)
The pattern in different countries is complex and considerable variation is seen between countries. The biggest reductions in cancer related DALYs have been seen in Czechia, Luxembourg, Denmark and Norway, whereas the biggest increases have been seen in Bulgaria and Romania. The cancers which cause the greatest disease burden measured in DALYs are lung cancer, colorectal cancer and breast cancer, while more recent data have shown that pancreatic cancer and prostate cancer increasingly contribute to the cancer burden (6).
Hofmarcher and colleagues in the Comparator Report elegantly summarised the major recent trends in cancer incidence, mortality, survival and cancer management (6). “The analysis of cancer incidence and cancer mortality revealed different trends. Measured in absolute numbers, incidence increased by around 50 percent and mortality by around 20 percent in Europe between 1995 and 2018. In the absence of the demographic development (positive population growth and population aging), incidence rates would still have increased in most countries, whereas mortality rates would have decreased in most countries. This discrepancy in the development of incidence and mortality is reflected in the simultaneous improvement in survival rates of different cancer types. The cause behind this development has been attributed to ‘major advances in cancer management’. Cancer management refers to all the actions that are taken in the cancer patient pathway. It encompasses primary prevention, screening, diagnosis, and treatment with curative and palliative intent.”
The Efficiency of Cancer Care
European cancer patients should have access to the best available cancer care, but the ability to provide this in a healthcare system depends on the availability of adequate resources and the efficiency with which they are used. Studies are beginning to identify variations between European countries in the efficiency of the healthcare which underpins the provision of cancer care and therefore the outcomes of their cancer patients. In these measures, the analyses make use of survival data and the inputs to achieve this level of survival measured by evaluating the numbers of staff, equipment and facilities dedicated. In essence, these measures relate the expenditure and service activities on cancer care to the outcomes achieved in different countries.
For example, in Figure 12 from the Comparator Report (6), the relationship between the percentages of patients surviving four cancers at one year after diagnosis and the total expenditure on cancer care per person in each country is set out.
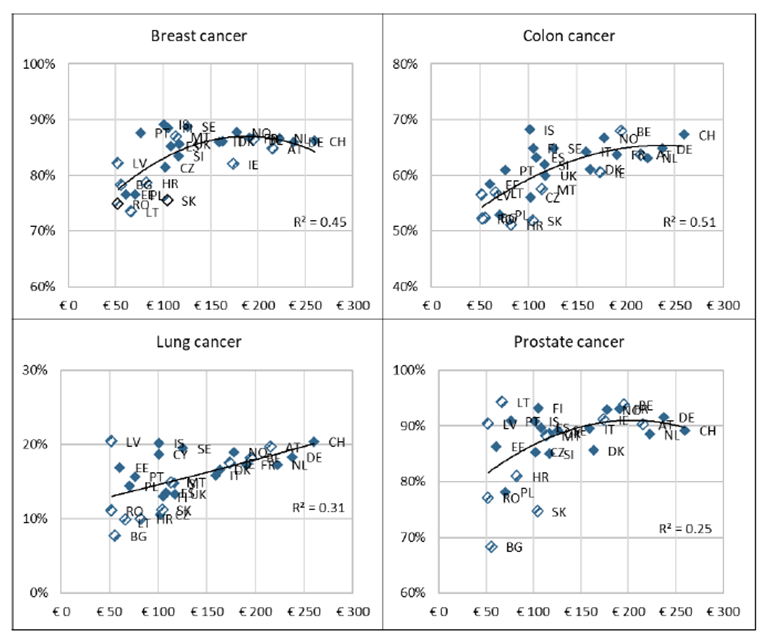
Figure 12. Cancer expenditure (in € per capita, PPP-adjusted) in 2010 and 5-year net survival (in %) in 2010–2014
Increasing expenditure is associated with improvements in survival. However, there is considerable variation between countries which is not explained by expenditure alone and this will in part reflect the efficiency of delivery of cancer care in each country (6).
In Table 2, a calculated efficiency score is compared to cancer survivorship data for breast cancer and lung cancer (6, 99). For breast cancer, Czechia, France, Italy, Poland, Slovakia and Slovenia have high efficiency scores. For lung cancer, Finland, France, Germany, Poland and Slovenia have high efficiency scores.
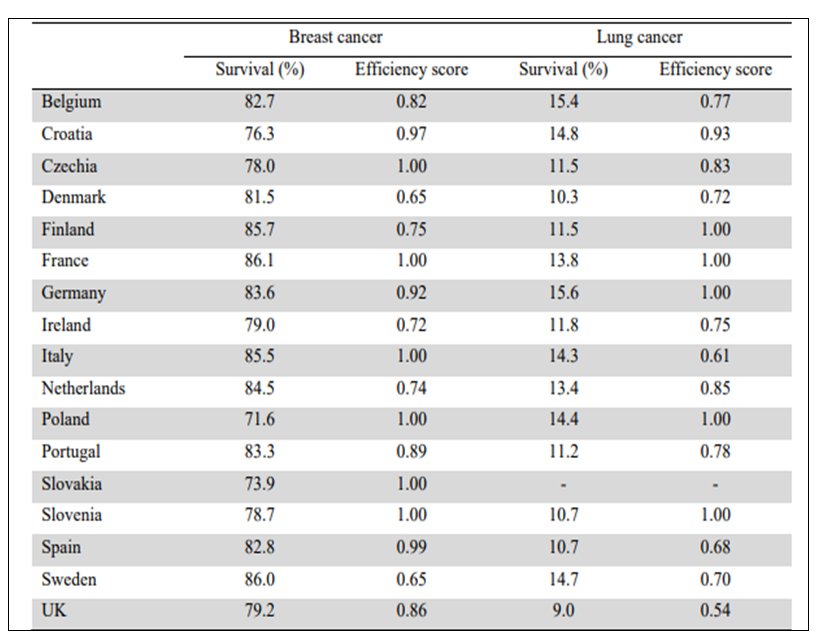
Table 2. Technical efficiency in the production of 5-year net survival in breast cancer and lung cancer, 2015. Efficiency scores can range from 0 (inefficient) to 1 (efficient) (6,99). The definition of Efficiency is given in reference 99
Unequal Use of Cancer Treatments
The recommendations of the CanCon EU joint action against cancer include “Ensure that all patients have access to appropriate systemic therapy” (5). However, costs of cancer medicines vary substantially between European countries. Figure 13 shows expenditure per head of population on cancer medicines for European countries in 2008 and 2018 (6). There has been a substantial increase in most countries and considerable variation between the countries. Highest expenditures are in Austria, Switzerland, Germany, Belgium and Denmark and the increased demand has led pharmacists to report shortages of cancer medicines.
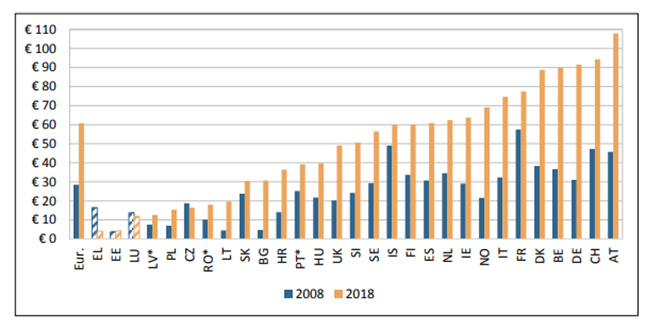
Figure 13. Cost of cancer medicines per capita (in 2018 price levels and exchange rates), 2008 & 2018 (6). Hatched bars are based on regional data or neighbouring countries in all Figures
CanCon further recommends “Ensure equitable access to high quality surgical care in all European Member States (5). However, there are significant differences in cancer outcomes, reflecting surgical access in different European countries (25, 26, 100-103).
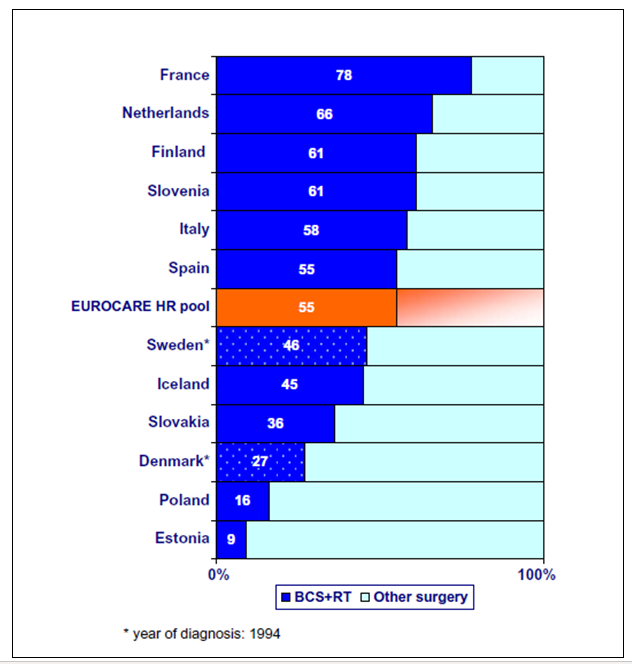
Figure 14. EUROCARE 3-breast cancer (T1N0M0) cases receiving standard good clinical cancer practice with Breast Conserving Surgery and Radiotherapy (From 100)
Figure 14 shows the results of a EUROCARE-3 (100) study of the uptake of standard good clinical cancer practice in the surgery of women with localised, small, lymph node negative breast cancer. The standard good practice was Breast Conserving Surgery and Radiotherapy (BCS+RT); the uptake of that practice in the countries studied ranged from 78% to 9%, reflecting the significant disparities experienced.
Cancon also recommends “Ensure availability of sufficient radiotherapy capacity with appropriate technology innovation in all European Union Member States” (5). Radiotherapy is essential in more than half of all cases of cancer, to cure localised disease and palliate symptoms. Considerable inequality exists in the availability of radiotherapy between European countries, which is reflected in the uptake of evidence based radiotherapy, the equipment available per citizen and per cancer patient and the proportion of optimal utilisation of radiotherapy treatments (70, 104-107) (Figure 15 and 16).
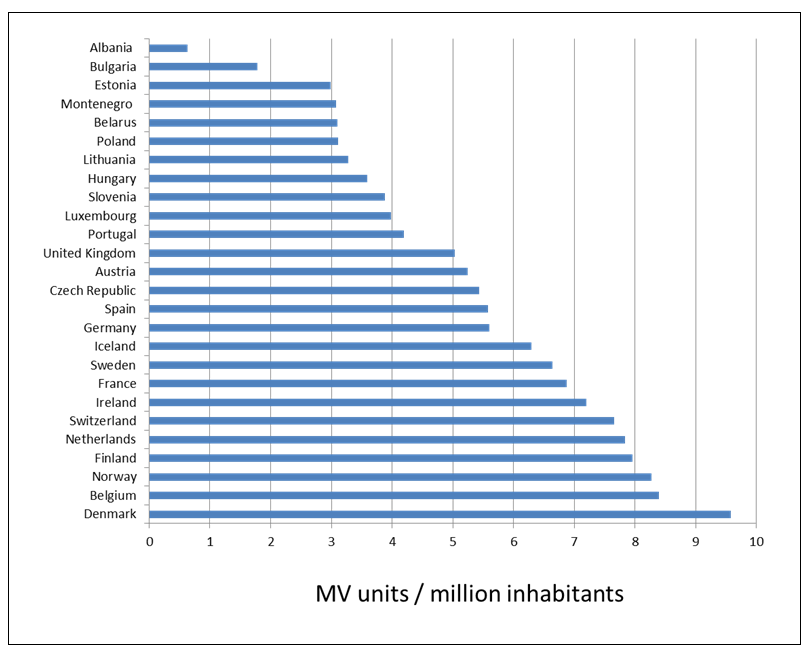
Figure 15. Number of megavoltage (MV) radiotherapy units per million inhabitants in Europe (70)
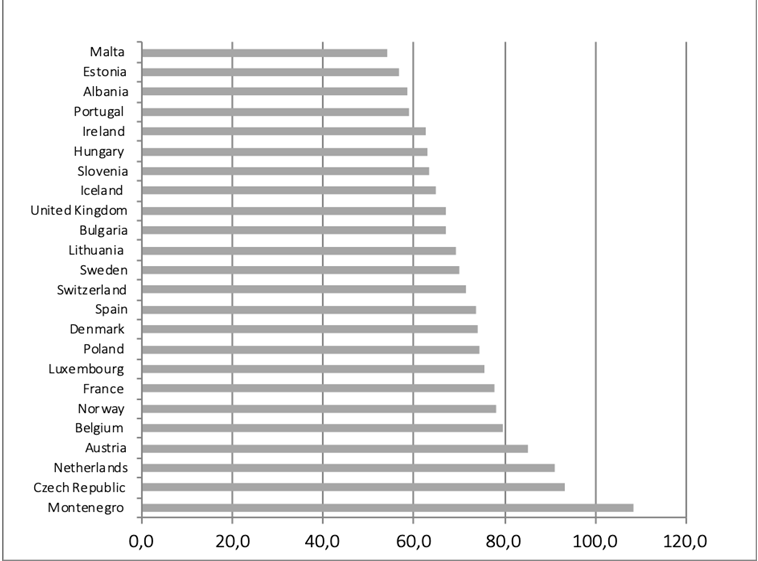
Figure 16. Actual radiotherapy utilisation as proportion of optimal evidence-based utilisation
Monitoring variations in access to good quality care and its influence on outcomes is a vital part of ensuring good practice for cancer patients. The European Registry of Cancer Care (EURECCA) (108) is “an international multi-disciplinary platform of clinicians and epidemiologists aiming to improve the quality of cancer care by ensuring data registration, promoting and incorporating feedback, forming plans for improvement and sharing knowledge of performance and science. The mission of EURECCA is to achieve and assure high-quality multi-disciplinary cancer management in Europe, accessible to all patients through the development and support of an international quality assurance structure which is an audit structure using anonymous patient data and compliant with national and international laws.”
The CanCon Joint Action drew attention to the importance of developing adequate staffing for the major oncology specialties in Europe (5). For example, in medical oncology, ESMO has examined the landscape of medical oncology in Europe and identified the wide range of staffing numbers available to support cancer patients in different countries (44, 109). A survey carried out by ESTRO showed considerable variation in radiotherapy staffing numbers, reflecting the disparate numbers of radiotherapy units in different European countries (45, 70, 110).